

Start your next CX report with a screenshot


First, attach an image of a report to CXP Analyst, CXP’s AI assistant for exploring customer conversations and reporting data. Then ask CXP Analyst to re-create the report with your data.
The screenshot provides the visual reference; the analysis uses the data your team already has access to in CXP. From there, you can refine the chart and ask follow-up questions about the trends, all in an AI conversation.
Build a report then expand on it
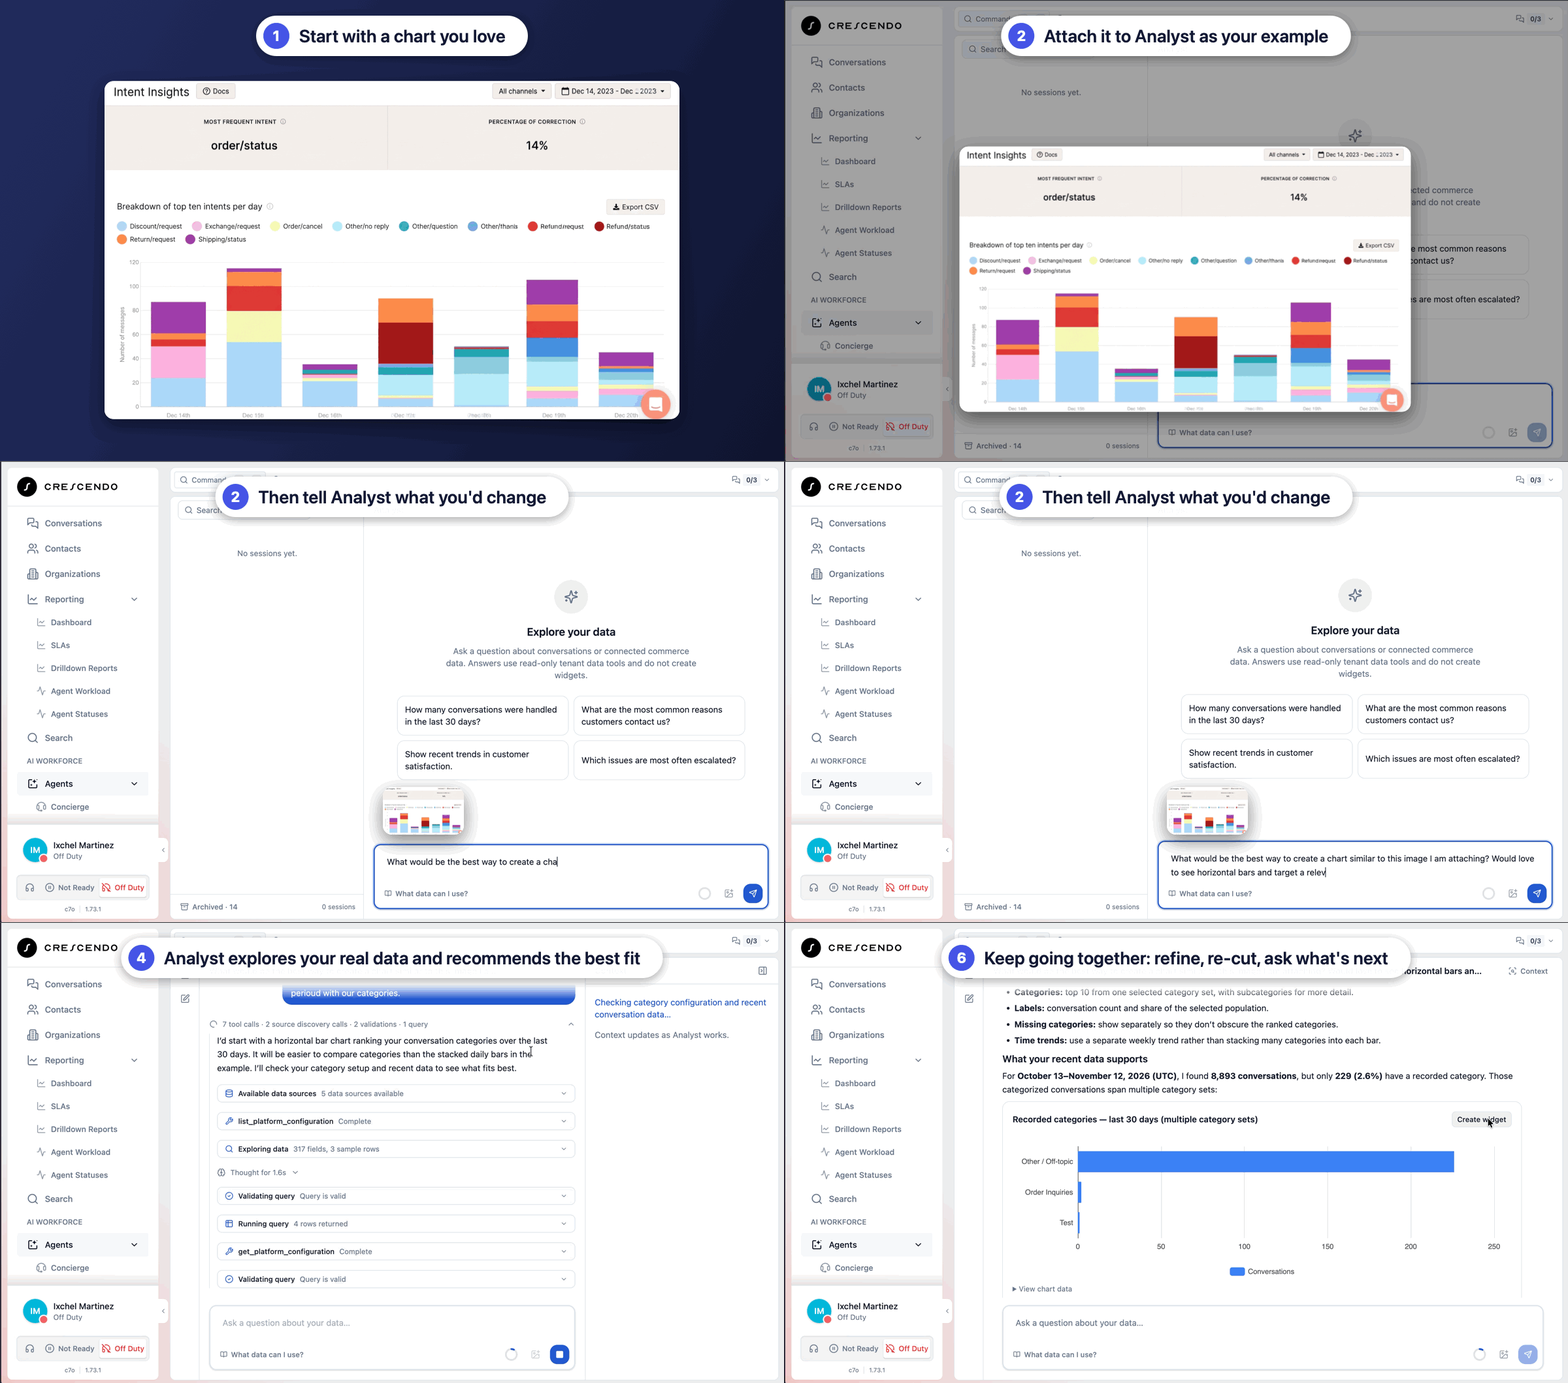
Say you’re getting ready for the weekly CX review. You have a chart from another reporting tool that breaks down contact categories the way your team is used to seeing them. You want the same view in CXP.
Attach the screenshot and make your ask. The image gives the Analyst the visual reference. The analysis then runs on the conversation and reporting data your team already has access to.
From there you can shape it. Focus on one category. Change the time period. Ask for a bar chart instead of a line. You make any and all of those calls in the conversation, with the example of what you want sitting right there.
What if you notice that, say, refund requests are climbing? Ask about what changed in those conversations. The Analyst can compare the two periods and pull relevant examples.
You came in wanting a chart. Now you’re reading what customers actually said. That jump, from reporting to understanding, used to be a separate project. Now, it's simply the next prompt.
Analyze existing charts
This works with charts that already live in CXP too. A trend catches your eye on a dashboard, you grab a screenshot, and you ask the Analyst to help you dig into that period. Same thing with a widget you have a question about.
You don’t have to describe every detail of a visual before you can start. Just reference it and ask about it in your own words. For someone who has written a lot of very careful report-builder queries, that small freedom turns out to be big.
Ask follow-up questions in separate threads
Real investigations don’t stay on one track. Let’s say you want to keep following the refund trend, but you also want to dig into a new trend you find in the data. You can fork the conversation from the point where things got interesting and explore the second question in its own thread, with the first one intact. If a response is going the wrong direction, stop it and adjust. The time period and sample size stay visible the whole way, so you always know exactly what you’re looking at. That’s what separates a chart that looks interesting from an analysis you can stand behind in the review.
When you have something useful, take it as a draft into Widget Builder, our tool that creates data visualizations, like dashboards. Review it, refine it, or go bigger. Share a screenshot of a full dashboard you admire and work through it with the Analyst one widget at a time. Each one lands in Widget Builder. You can arrange all of the views the way you want them — the work you just did now has somewhere to live.
Start with a screenshot. Build toward an answer.
You’ve probably opened a report builder and worked backward from the tool. This flips the order. You start with the thing you want to understand, show an example, and work through it with the data. A screenshot becomes an investigation, which in turn becomes a dashboard you keep using.
Start with the chart you’ve been wanting to build. Show the Analyst what you mean.
Run Your Entire CX Operation on One AI-Native Platform

Keep Reading
